Anomaly(Outlier)Dection Mark Lin @MLEng Team Transwarp
Definition
- Hawkins - Outlier:
An outlier is an observation that deviates so much from other observations as to arouse suspicion that it was generated by a different mechanism.
Applications of Anomaly Detection
- Network intrusion detection
- Insurance / Credit card fraud detection
- Healthcare Informatics / Medical diagnostics
- Industrial Damage Detection
- Image Processing / Vedio surveillance
- …
Key Challengs
- Defining a representative normal region is challenging
- The boundary between normal and outlying behavior is often not precise
- The exact notion of an outlier is different for different application domains
- Availability of labeled data for training / validation
- Data might contain noise
- Normal behavior keeps evolving
Contents
- Graphical Approach: Box-plot
- Statistic Approach: Univariate / Multivariate Gaussion Distribution
- Distance-based Approach
- Density-based Approach: LOF
- Model-based Approach: Isolation Forest, RNN
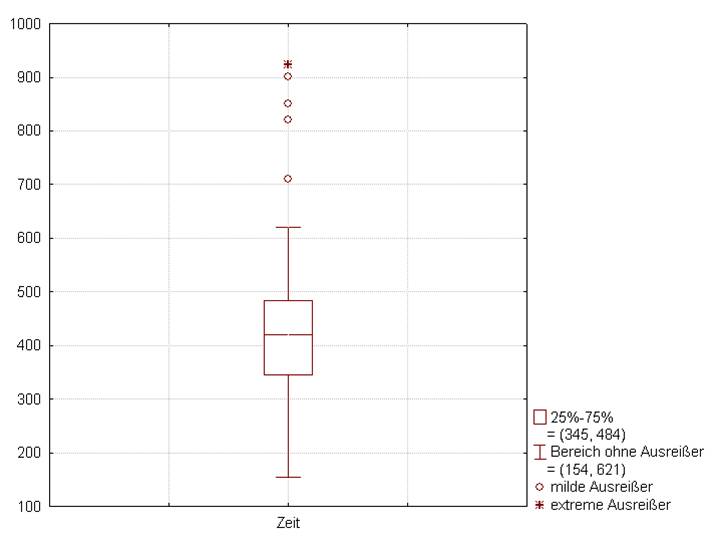
Box-plot
- The bottom and top of the box are the first and third quartiles
- The band inside the box is the second quartile (the median)
- The lowest datum within 1.5 IQR of the lower quartile, and the highest datum within 1.5 IQR of the upper quartile
Contents
- Graphical Approach: Box-plot
- Statistic Approach: Univariate / Multivariate Gaussion Distribution
- Distance-based Approach
- Density-based Approach: LOF, RNN
- Model-based Approach: Isolation Forest
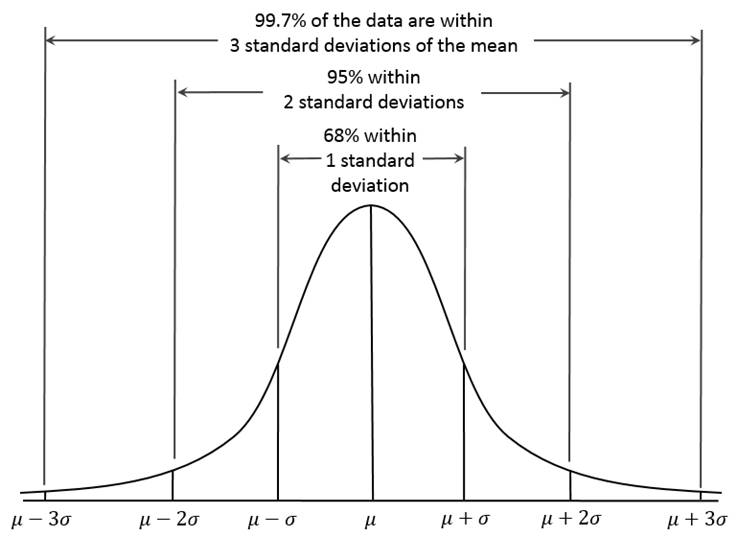
Statistical Approach
- General idea
- Given a certain kind of statistical distribution (e.g., Gaussian)
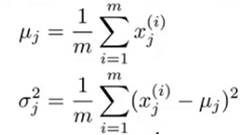
- Compute the parameters assuming all data points have been generated by such a statistical distribution (e.g., mean and standard deviation)
- Outliers are points that have a low probability to be generated by the overall distribution
- Basic assumption
- Choose a feature xj that might be indicative of anomalous examples.
- Fit parameters u1, …, un, σ12,…, σn2
- Given new example x, compute p(x):
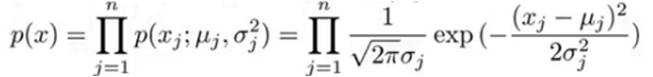
- Anomaly if p(x) < ε
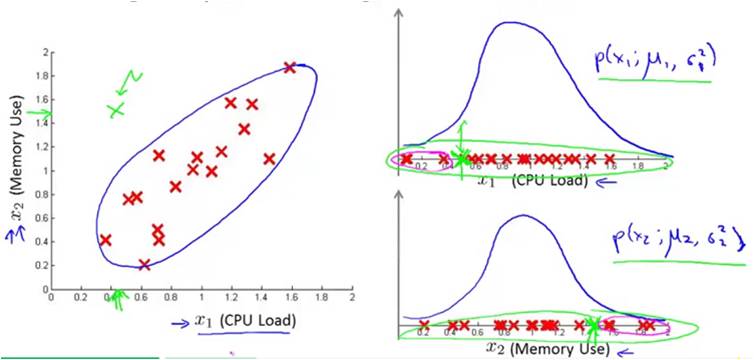
Multivariate Gausssian Distribution
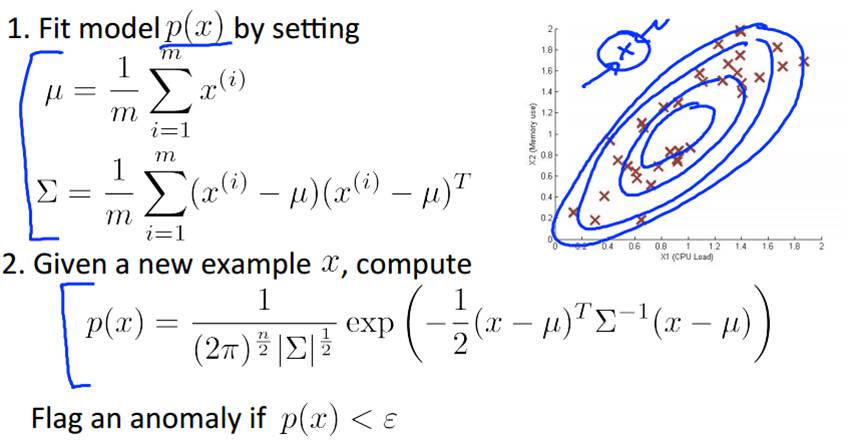
Problems
- Mean and standard deviation are very sensitive to outliers.
- These values are computed for the complete data set(including potential outliers).
- It is hard to choose a good ε.
- Data distribution is unknown.
Contents
- Graphical Approach: Box-plot
- Statistic Approach: Univariate / Multivariate Gaussion Distribution
- Distance-based Approach
- Density-based Approach: LOF, RNN
- Model-based Approach: Isolation Forest
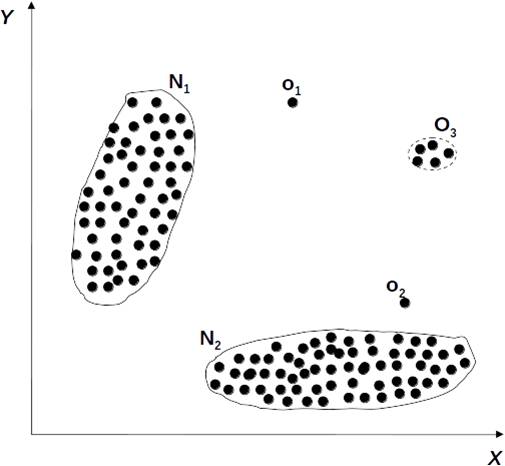
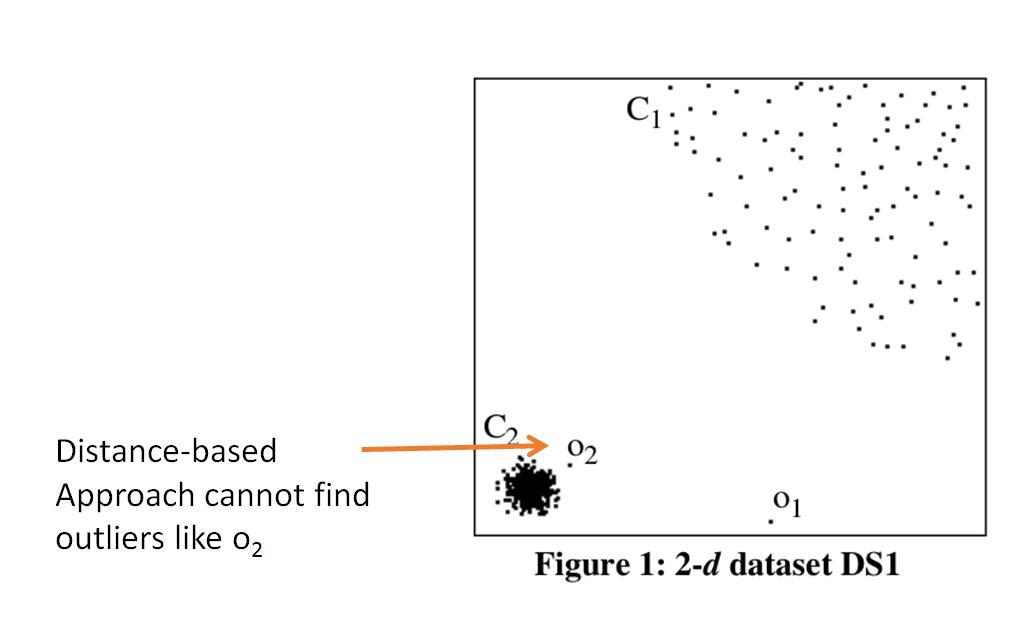
Distance-basd Approach
- General idea
- Judge a point based on the distance to its neighbors
- Basic assumption
- Normal data objects have a dense neighborhood
- Outliers are far apart from their neighbors, i.e., have a less dense neighborhood
- Compute the distance between every pair of data points
- There are various ways to define outliers:
- Its assumption does not always work in all situations.
- Computing the distance between every pair of instances is quite expensive.
- Curse of Dimensionality.
Contents
- Graphical Approach: Box-plot
- Statistic Approach: Univariate / Multivariate Gaussion Distribution
- Distance-based Approach
- Density-based Approach: LOF
- Model-based Approach: Isolation Forest, RNN
Local Outlier Factor
- General idea
- Compare the density around a point with the density around its local neighbors
- The relative density of a point compared to its neighbors is computed as an outlier score
- Basic assumption
- The density around a normal data object is similar to the density around its neighbors
- The density around an outlier is considerably different to the density around its neighbors
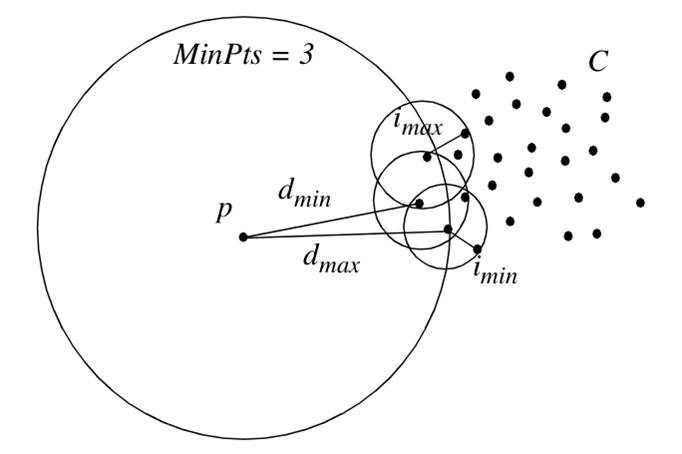
K-distance of an Object p
For any positive integer k, the k-distance of object p, denoted as k-distance(p), is defined as the distance d(p, o) between p and an object o ∈ D such that:
(i) for at least k objects o’∈ D \ {p} it holds that d(p, o’) ≤ d(p, o) and
(ii) for at most k-1 object o’ ∈ D \ {p} it holds that d(p, o’)<d(p, o)
Given the k-distance of p, the k-distance neighborhood of p contains every object whose distance from p is not greater than the k-distance, i.e. Nk-distance(p)(p) = { q ∈ D \ {p} | d(p, q) ≤ k-distance(p)}.
These objects q are called the k-nearest neighbors of p.
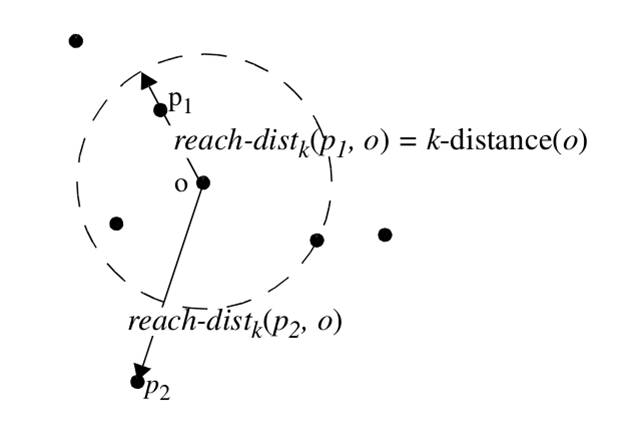
Reachability Distance of an Object p w.r.t. Object o
Let k be a natural number. The reachability distance of object p with respect to object o is defined as
reach-distk(p, o) = max { k-distance(o), d(p, o) }.
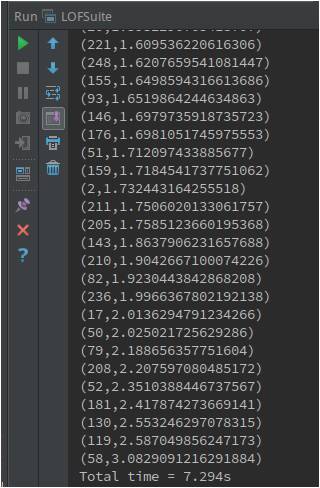
Distribution of Outlier Score
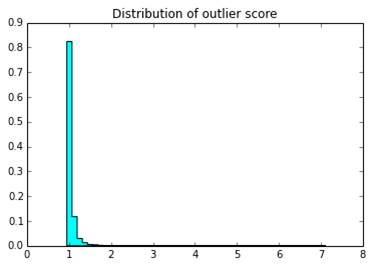
It can be observd that, the optimal outlier score threshold to decide whether a data-point is outlier or not is around 2 for most of the cases.
Summary
- compute the (euclidean) distances between every object and other objects in the dataset. O(n2)
- rank the (euclidean) distances.O(nlogn) (nearest neighbor problem)
- compute the reachability distance of each object.
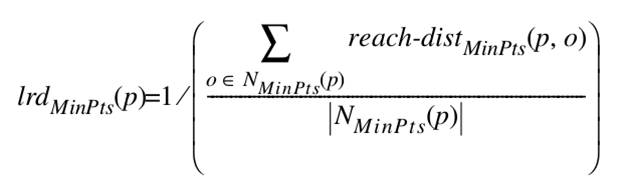
- compute the local reachability density of each object.
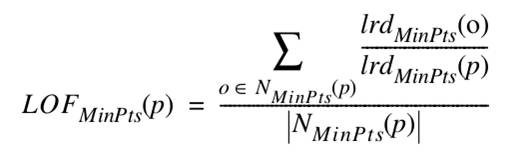
- compute the local outlier factor of each object.
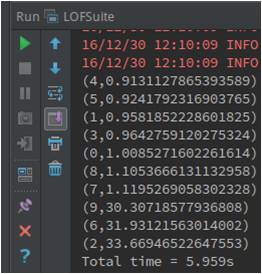
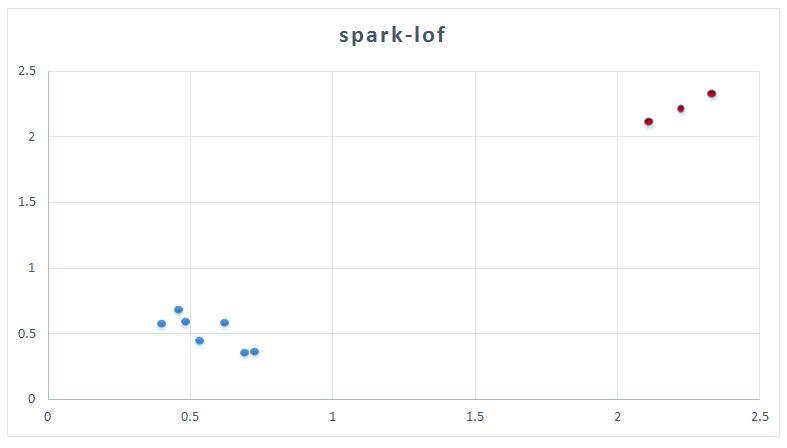
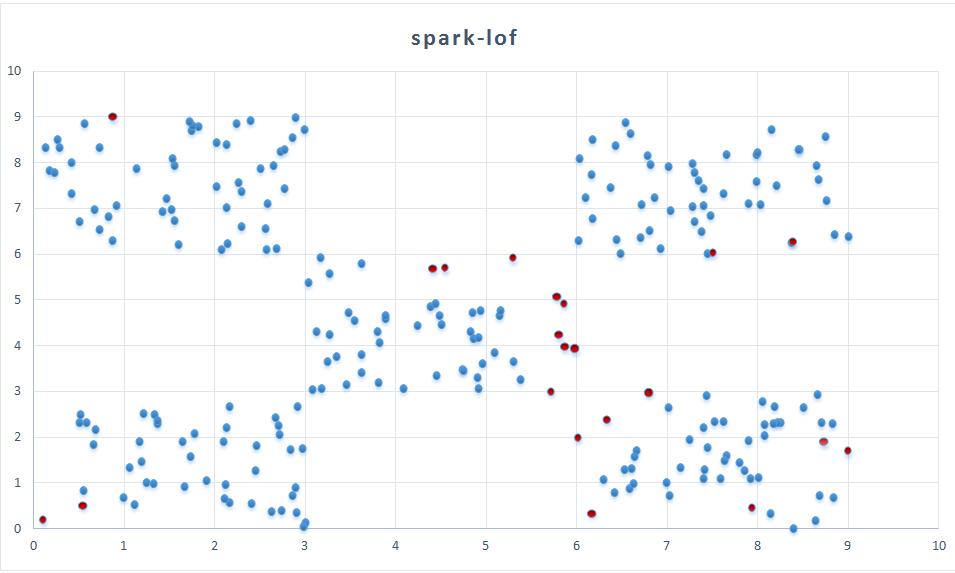
spark-lof
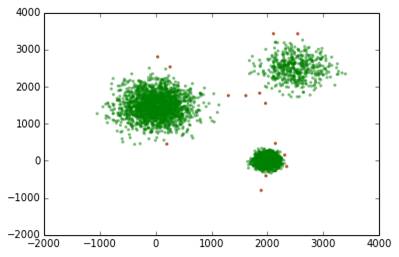
Visulization
Problems
- Exponential runtime
- Curse of dimensionality
Contents
- Graphical Approach: Box-plot
- Statistic Approach: Univariate / Multivariate Gaussion Distribution
- Distance-based Approach
- Density-based Approach: LOF
- Model-based Approach: Isolation Forest, RNN
Isolation Forest
Most existing anomaly detection approaches construct a profile of normal instances, then identify anomalies as those that do not conform to the normal profile.Their anomaly de-tection abilities are usually a ‘side-effect’ or by-product of an algorithm originally designed for a purpose other than anomaly detection (such as classification or clustering).
This leads to two major drawbacks:
(i) these approaches are not optimized to detect anomalies—as a consequence, these approaches often under-perform re-sulting in too many false alarms (having normal instances identified as anomalies) or too few anomalies being detected;
(ii) many existing methods are constrained to low dimensional data and small data size because of the legacy of their original algorithms.
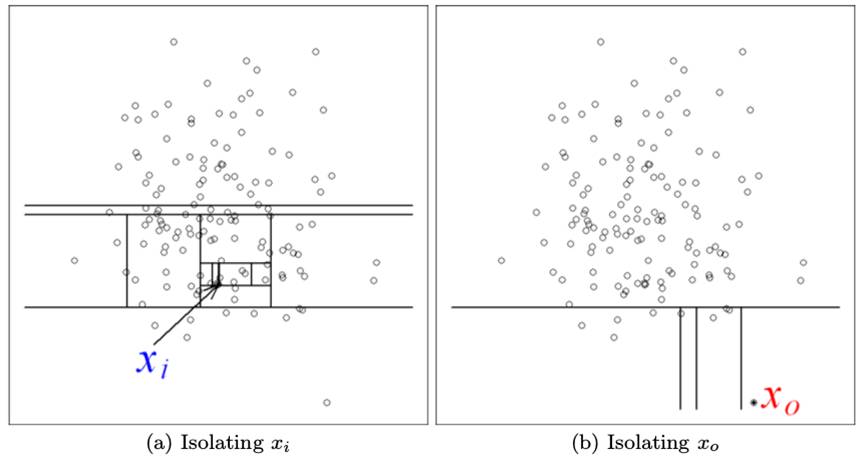
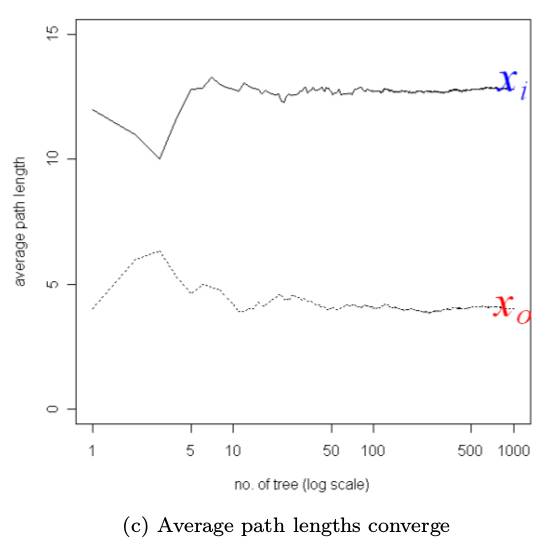
Assumption:
Isolation Forest detects anomalies by isolating instances, without relying on any distance or density measure.
i) they are the minority consisting of few instances, and
ii) they have attribute-values that are very different from those of normal instances.
Isolation can be implemented by any means that separates instances.
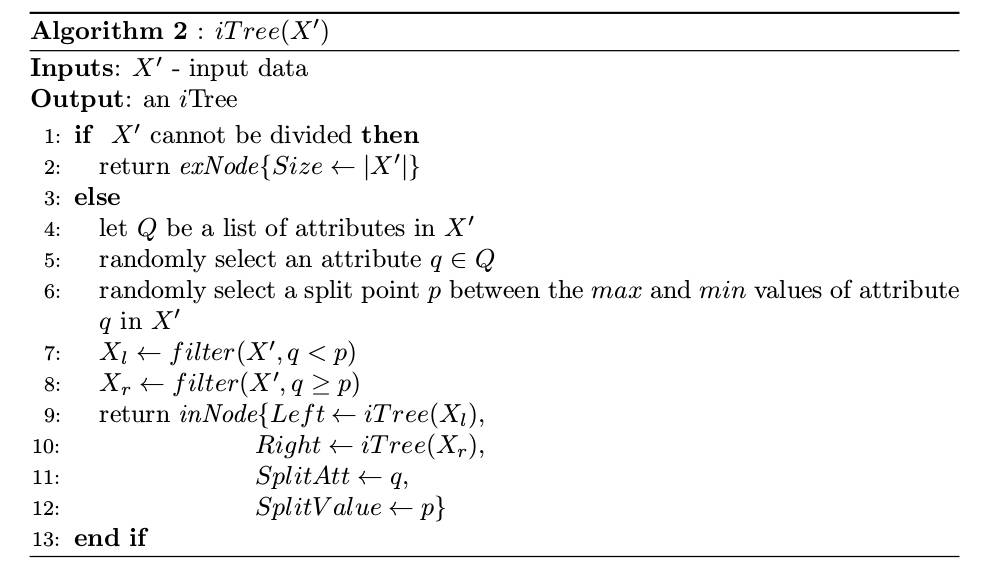
Isolation Tree
Let T be a node of an isolation tree. T is either an external-node with no child, or an internal-node with one test and exactly two daughter nodes (Tl, Tr). A test at node T consists of an attribute q and a split value p such that the test q < p determines the traversal of a data point to either Tl or Tr.
Isolation Forest: Training Stage
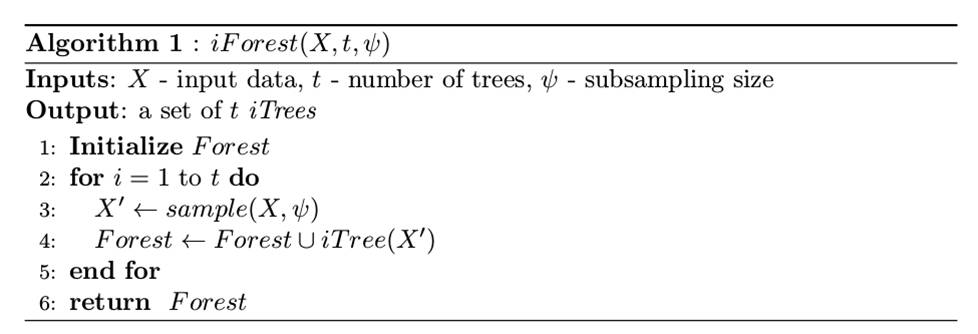
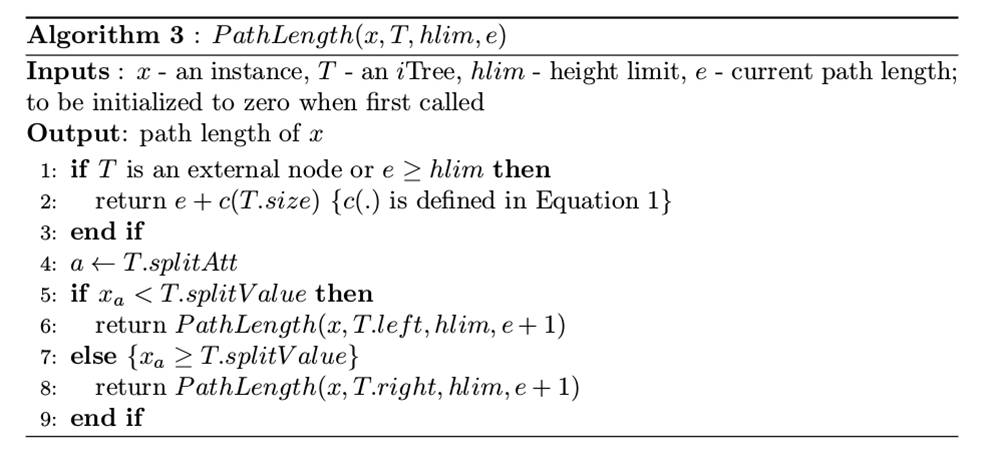
Isolation Forest: Evaluation Stage
Isolation Forest: Anomaly Score
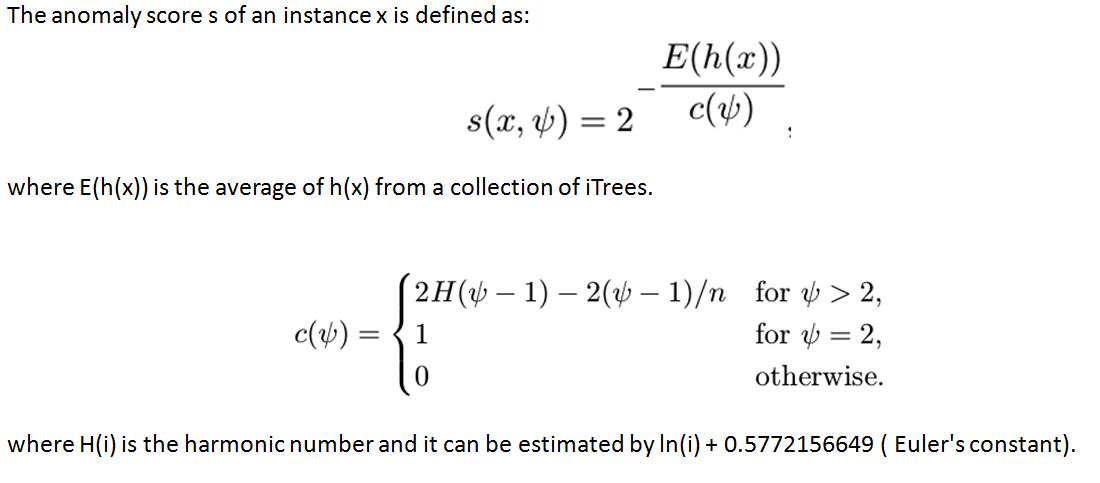
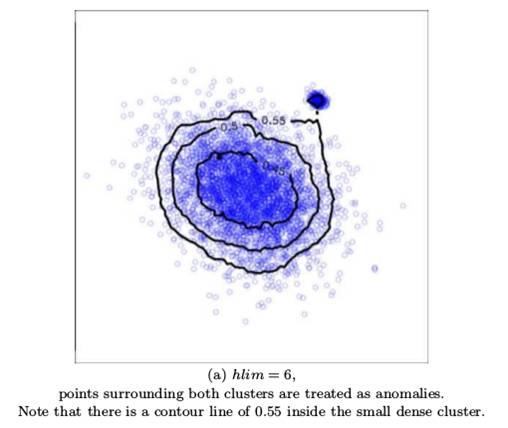
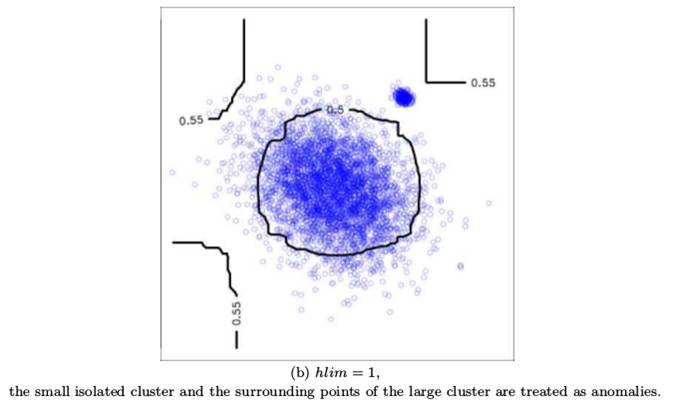
Adjusting the Granularity of Anomaly Scores
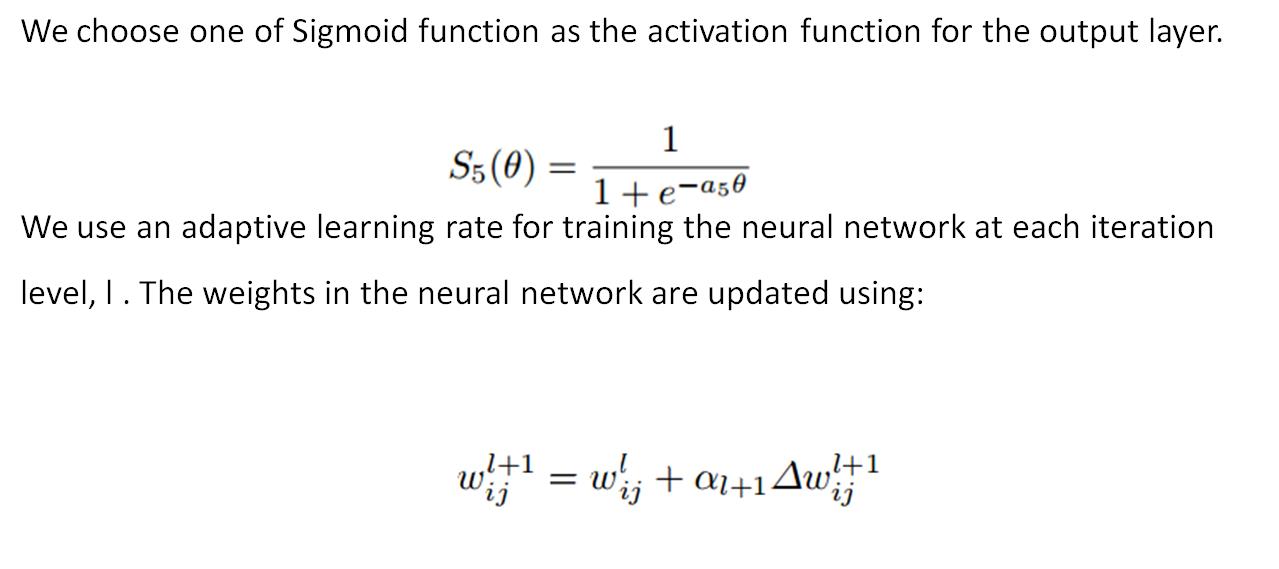
Replicator Neural Networks(RNNs)
Assumption:
The RNN attempts to reproduce the input patterns in the output. During training, the weights of the RNN are adjusted to minimise the mean square error (or mean reconstruction error) for all training patterns.
As a consequence, common patterns are more likely to be well reproduced by the trained RNN so that those patterns representing outliers will be less well reproduced by a trained RNN and will have a higher reconstruction error.
The reconstruction error is used as the measure of outlyingness of a datum.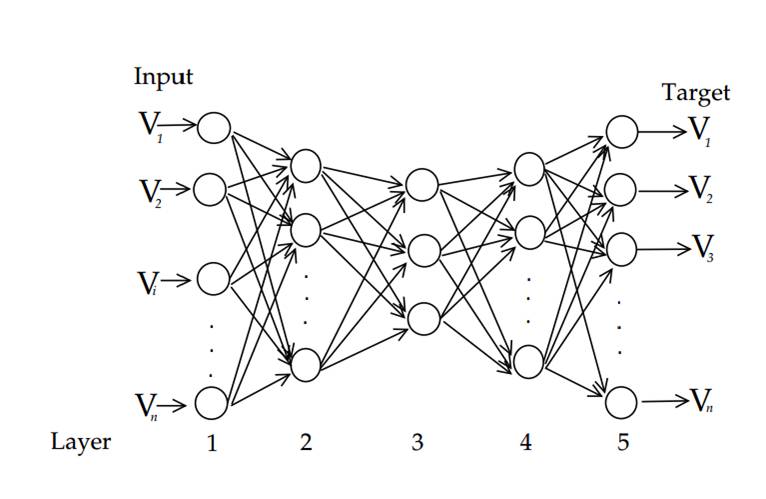
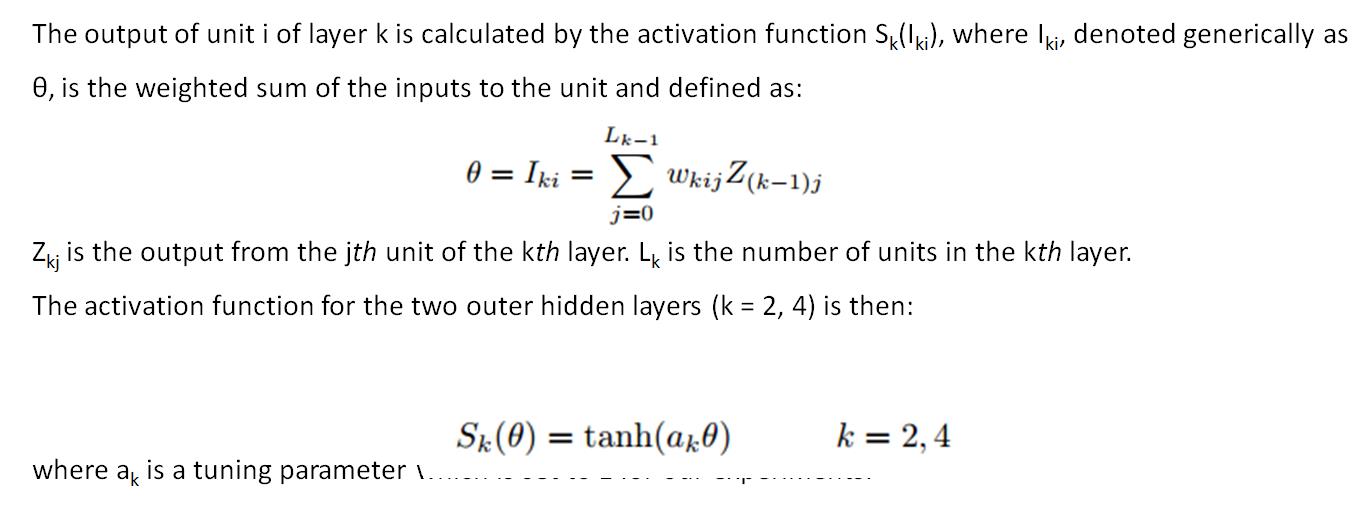
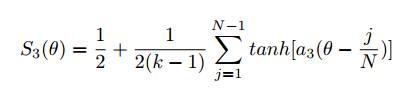
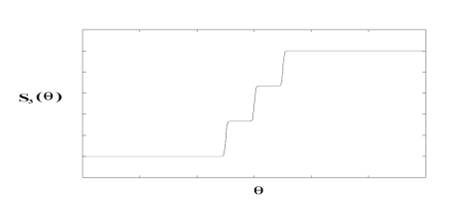
For the middle hidden layer (k = 3), the activation function is staircase like with parameter N as the number of steps or activation levels and a3 controlling the transition rate from one level to the next
Cost Funtion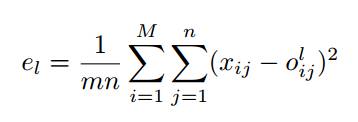
m is the number of records in the training set, n is the number of features, and xij is the input value and is also the targeted output value (i = 1, 2, . . . , m, j = 1, 2, . . . , n) and olij is the value of the output from the RNN for the lth iteration.
Outlier Factor (OF)
We define the Outlier Factor of the ith data record OFi as our measure of outlyingness. OFi is defined by the average reconstruction error over all features (variables)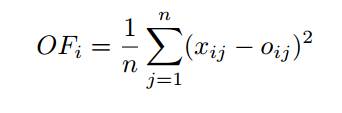
where n is the number of features. The OF is evaluated for all data records using the trained RNN.